Introduction:
As an extension of last week’s activity, this week
we navigated the Priory course using a global positioning system. Features within the GPS allowed us to track
and upload our paths to the various points making it effective in showing our
precise locations. This relatively modern technique has a number
of advantages and disadvantages that will be covered in the course of this
report.
Study Area:
Methods:
For our GPS land navigation exercise we used a
Garmin etrex GPS unit (figure 1). Although
this unit is somewhat outdated compared to a more modern GPS, they are quite
inexpensive and useful for simple tasks such as land navigation. By using at least three satellites this
system can determine your location on an X, Y, and Z axis. Once the GPS location is triangulated using
the satellites, the location can be displayed either as coordinates or with a
map marker. For our purposes, we used
the coordinates displayed using a UTM coordinate system.
 |
| Figure 1: The Garmin etrex GPS was used throughout the data collection process. Data points were collected using the track log feature and uploaded into ArcMap to view spatially. |
After being given our point locations and our punch
card, our group activated the GPS track log and set off towards the first
point. The track log is simply a saved coordinate
location using a set time interval. This
feature will be explained further in the results portion of this report. For finding our points we used the simple
technique of watching our X and Y coordinates increase or decrease in the
direction of our point. This procedure
became quite painful as we navigated in steep, snow covered terrain trying to
find the correct direction. Figure 2
shows the conditions we had to traverse through.
 |
| Figure 2: The conditions were far from ideal with snow drifts up to two feet deep. Navigating through this much snow was exhausting but fun. |
Snow
picture
After finding all of our points, we were tasked with
uploading our track log data and dismissed from class. The track log data was quite easy to upload
using the DNR GPS program provided on University computers. Once the GPS is plugged in with a USB cord
you can connect to it by selecting Connect to Default GPS located in the GPS
tab (figure 3).
 |
| Figure 3: For the DNR GPS program to recognize the GPS, you must first establish a connection. |
Once the GPS device is recognized you can begin adding
your track log by selecting download under the Track tab (figure 4). The program will then begin extracting your
data to the computer for you to save. It
may take a few minutes depending on the amount of points that were stored on
the GPS. Some people had relatively
fewer points than others, for example my GPS stored 5,795 points while Joey’s
only stored 576.
 |
| Figure 4: Once the GPS is connected to the program, you can begin downloading your data points. The image above shows the location for downloading your log. |
After the points are all uploaded onto the computer,
the next step is to save them as a shapefile to be imported and projected using
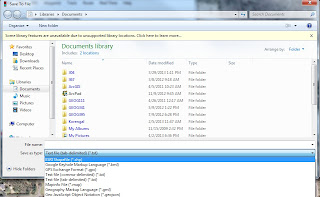
ArcMap. To save the points as a
shapefile navigate to file>save to> arcMap>file. Next you will be
prompted to name your file and select the file type important: make sure you select ESRI Shapefile (*.shp) as the type
as seen in figure 5.
 |
| Figure 5: It is important so save your data as a shapefile so that it can be easily uploaded into ArcMap. Once the data was in ArcMap, we saved it as a feature class for ease of distribution. |
The data is now ready to be imported into arcMap and
saved as a feature class to be distributed amongst our group. Figure 6 shows my
uploaded track log in ArcMap.
 |
| Figure 6: My uploaded track log showing where I traveled throughout the Priory. |
Results:
After conducting this navigation exercise, I prefer
using the traditional map and compass technique. It seemed that the GPS technique was much
less efficient. We spent a lot of our time walking in one direction just to
find our numbers getting further away from our goal and then having to backtrack.
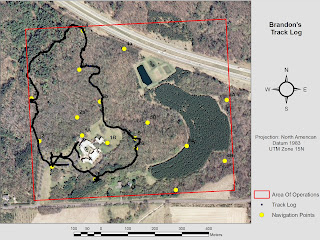
Figure 7 below shows my track log projected on an aerial image of the study
area. Notice the southwest group of
points and how many directions we traveled just to orient ourselves towards the
first point. After finding point 1, we started
to get the hang of it a little better; however, we still found ourselves
straying at times and needed to correct our direction. We would have found the
points much more quickly had we set a waypoint to the coordinates given.
For the most part, our group’s track logs all lined
up with one another’s. In certain cases, we would send someone in one direction
and another person in a different direction to compare the coordinates. Many of the curves seen in the track logs,
such as east of point 3a, are caused by us maneuvering around obstacles like steep
draws (figure 8).
The classes track log data shows all of the points
being visited by each group. Groups that
inserted the coordinates as a waypoint were much more efficient on reaching
their points in a timely manner. Figure 9 shows each person navigating
throughout the course.
 |
| Figure 9: All 18 points were visited by at least one group. |
Despite the difficult terrain and heavy accumulation of snow, our group was able to navigate to all of our points. Although I felt the GPS technique was less efficient than traditional map and compass navigation, it gave us lots of data to incorporate into a geographic information system. In the upcoming post, I will be using time animation to provide additional information on our activity.


No comments:
Post a Comment